

A short follow-up this week to a post a couple of weeks ago when we discussed the stock market’s longest losing streak. At the time, I was working on an asset liability matching exercise to inform my asset allocation. My interest in this topic was inspired by a presentation from Bill Bernstein over at Paul Merriman’s YouTube channel–an excellent primer on lifecycle investing for anyone who is interested. I’m working on a longer post about lifecycle investing that will consider some of the issues and recent critiques of the model from various academics and practitioners (including Bernstein).
I recently learned that the minimax principle I stumbled on comes from John von Neumann and game theory (because there is nothing new under the sun). Asset Dedication has some great informational materials on their website about Dedicated Portfolio Theory if you want to apply these principles in a more disciplined fashion.
If you recall, the longest amount of time it took stocks to recover was about 22 years. But I noticed something dramatic about how the recovery time changed depending on stock market valuations. Specifically, higher stock market valuations were more associated with long recovery times, which should come as no surprise.
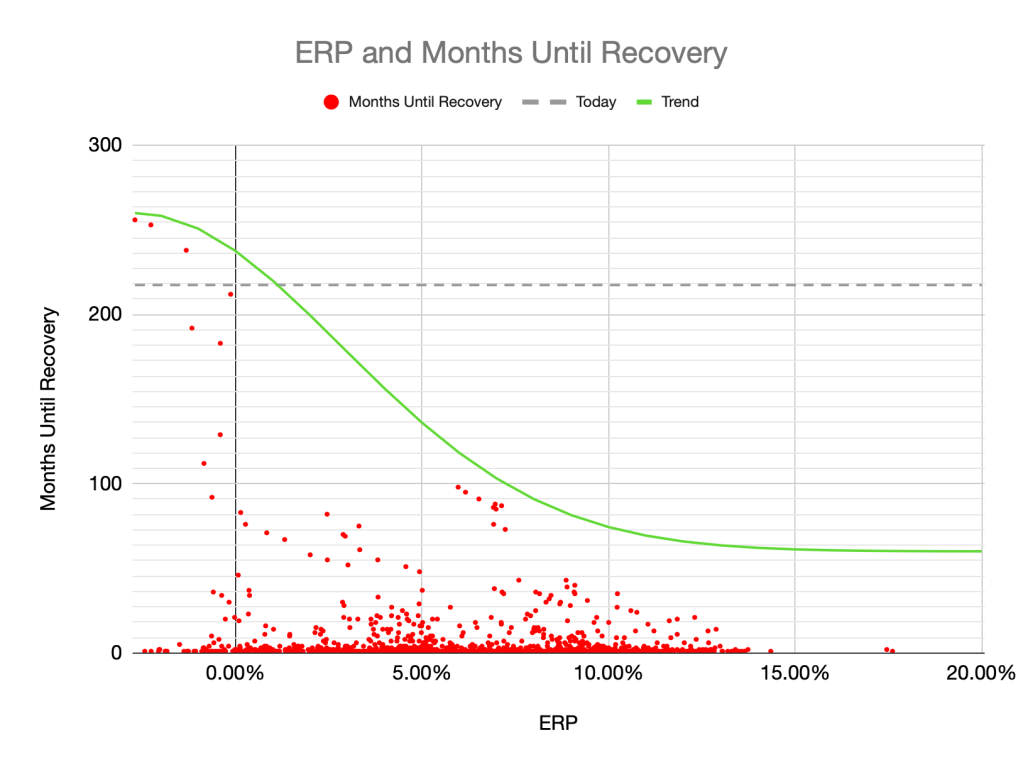
The chart below shows the months until recovery plotted against the Equity Risk Premium (ERP) for every period since 1881:

The Equity Risk Premium (ERP), which we’ve discussed before, is the cyclically adjusted earnings yield (CAEY) on the S&P 500 minus the real yield on bonds. On the far left of the chart you can see the longest recovery time (256 months) started in 1929, when the ERP was negative 2.70%. If you had invested in stocks at that time, you would have been better off funding any liability you had with bonds unless the liability was farther out than 256 months.
But you’ll notice that periods with higher ERPs generally had a lower maximum number of months to recovery. For example, there has never been a period longer than 100 months (8.33 years) to recovery when the ERP was above 5 percent.
For a rough approximation of the relationship between ERP and recovery time for asset allocation purposes, I estimated a curve that decreases as the ERP increases and levels off around 60 months (5 years)1.
There is a good reason for the apparent relationship between ERP and months to recovery.2 Stocks tend to be mean-reverting rather than following a random path. When valuations are stretched, stocks can underperform over longer periods of time. On the other hand, when stock valuations are low, any underperformance is relatively short-lived.
Another way to think about it is through risk lens. If the ERP increases, your risk of underperformance decreases, so you could reduce your bond allocation, trading out the longer duration bonds for stocks. If you enter a period of low ERP, your risk of underperformance increases, so you could extend the duration of your bond allocation and reduce stock exposure.
In a sense this is a dynamic allocation strategy that in practice is not unlike the Merton Share I discussed a couple months ago. But in this case, it is the worst-case recovery period as a proxy for stock duration that informs your asset allocation, not expected return, volatility or your risk tolerance.
Today, the ERP stands at about 0.74% (2.56% CAEY – 1.82% Real Yield on TIPS = 0.74% ERP). If history is any guide, using the curve estimated above, the longest recovery period would be no longer than 225 months or 18.75 years. If you had a portfolio of only the S&P 500 and 10 Year Bonds, a “safe” choice might be to fund any liabilities between now and 18.75 years from now with bonds. Anything beyond that time period could be funded with stocks. You could also use stocks to fund discretionary expenses in the interim, with the understanding that you would need to reduce spending during a drawdown.
This method would require some finesse if you have assets other than an S&P index fund. You would need to backtest it and data isn’t readily available before 1970 for equity markets outside the United States. Adding other uncorrelated assets such as real estate, gold, and commodities could also help reduce recovery time. These limitations may make it somewhat impractical for most people. Either way, while there is no guarantee that the future will look like the past, I tend to think that we’re unlikely to see another Great Depression and it is a good proxy for maximum recovery time.
- 60 months was a completely arbitrary choice. I could have chosen a higher or lower bound with the understanding that it would affect the minimum bond allocation. ↩︎
- The relationship between ERP and months to recovery isn’t statistically strong, likely due to the large number of data points with 1 or 2 months to recovery. ↩︎

You must be logged in to post a comment.