

Building Your Dynamic Allocation Blueprint
This is the third in a three-part series on Asset Allocation. Read Part 1 here and Part 2 here. This article has been updated for clarity and as our methodology has changed.
In the previous two articles, we teased the Merton Share as a rational framework for portfolio asset allocation. Now, let’s dive into how you can use both the CAPE ratio and the Merton Share to align your portfolio with your investing horizon, risk appetite, and current market valuations, without constant tinkering.
To quickly recap, we’ve seen that blindly relying on historical stock market averages for your retirement planning can be a big mistake. Why? Because past performance doesn’t guarantee future results, and current market valuations, as revealed by the CAPE ratio, suggest that future returns might be much lower than those rosy historical averages. The CAPE ratio helps us get a more realistic “expected return” for the long term. Then, we introduced the Merton Share, a powerful formula that helps you figure out your ideal stock allocation by considering three key things: the expected extrareturn from stocks (above a risk-free rate), how much stocks bounce around (their volatility), and your own personal comfort level with risk (your risk aversion).
Bringing the World into Your Portfolio: International Equities
The U.S. stock market might be the biggest, but it’s not the only market. And right now, with the U.S. CAPE ratio sitting pretty high, other global markets might offer better value.
Incorporating international equities into your portfolio is a smart move for diversification and potentially higher expected returns. Just like with U.S. stocks, you can use the CAPE ratio for international markets to gauge their long-term expected returns. Research shows that the same relationship between CAPE and future returns holds true in many international stock markets.
To figure out the overall expected return for a global equity portfolio, you’d combine the expected returns (CAEYs) of both U.S. and international equities, weighted by their market capitalization or your desired mix. For example, if you invest half in U.S. stocks with an expected return of 3% and half in non-U.S. stocks with an expected return of 5%, your blended expected return would be 4%.
Although the Merton share says we should reduce our allocation to risky assets according to the square of the volatility, this simple calculation doesn’t apply to correlated assets like US and International stocks. Instead, the optimal allocation between two risky assets and one risk-free asset is determined by a multi-asset model. Unfortunately, the details of this calculation aren’t worth exploring here because it results in the absurd weightings listed below (using a risk aversion of 2):
| Asset Class | Allocation |
|---|---|
| US (S&P 500) | -35.29% |
| International (Large Cap Dev.) | 76.75% |
| 10-Year TIPS | 58.53% |
The model suggests negative exposure to the S&P 500, actively shorting it or avoiding it altogether. That would be highly impractical for most investors and likely cost more to implement than it would produce in returns. This is where the model’s assumptions tend to break down.
Instead of a strictly Merton-inspired approach, you might consider one of the following three options:
- Market cap weighting (currently 50-65% US): Not as straightforward as you would think. Different indices count market caps differently and some countries, like Russia for example, have been removed from global indices.
- Minimum variance portfolio (about 60% US): This allocation minimizes the total risk (variance) of your combined portfolio. The formula uses the standard deviation of the assets and their correlation coefficient to determine the lowest risk mix of the two assets at a given return. If we look at historical volatility, US stocks have been slightly less volatile, so the minimum variance portfolio overweights to them slightly.
- Fundamental weighting: Allocating based on relative fundamentals of each geography. I will speak about this more in an upcoming blog post. Research Affiliates is a good source for information about this strategy in the meantime.
The minimum variance portfolio was determined using historical return data from 1970-2025. The chart below shows you the standard deviation of 100 portfolios with different allocations to domestic and foreign stocks.
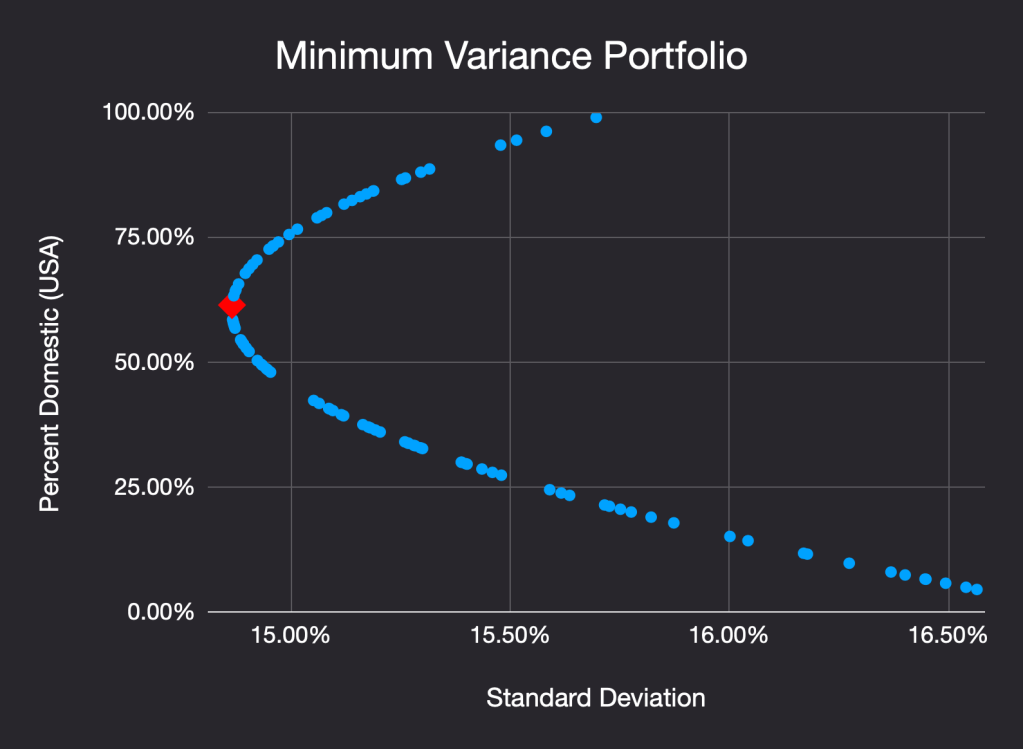
The red diamond in the chart represents the portfolio with the lowest standard deviation and is about 60% US / 40% International. The minimum variance portfolio is also well within the range of market cap weighting estimates.
Setting your baseline ERP
Now that we’ve decided on the mix of US and International stocks, we need to talk about what an “appropriate” baseline ERP is. This is somewhat of a guessing game, but history can be a guide. Fitting historical ERP to a trend-line, it has fallen closer to the 3% range, but was higher than 5% as recently as the 1980s:
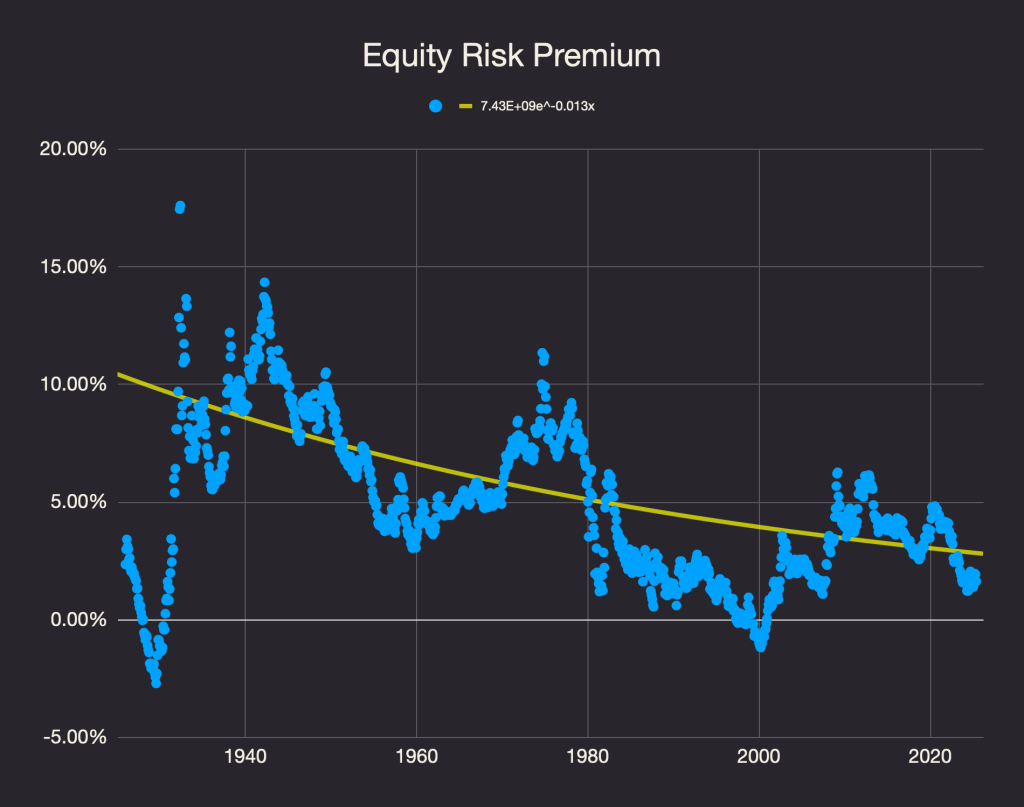
Side note: You’ll notice that during periods of market highs, the ERP can be as low as or less than zero, such as before the Great Depression or in the late 1990s as we discussed in Part 1. While the TIPS yield was higher than the CAEY during the Tech Bubble, there were no TIPS offered by the Treasury in the 1920s. The ERP in this chart is therefore an estimate based on the difference between the CAEY and the inflation-adjusted yield on 10-year Treasuries.
While I like the trendline approach, it isn’t predictive. To avoid overfitting, you can think about the amount of return you would need above the yield on TIPS to be willing to take on the risk of owning stocks. Personally, I think the market is largely correct on the trend (but not the current ERP), so 3% works for me. If you choose a larger number, you will have lower exposure to stocks; a lower number means higher exposure.
Another way to think about this is to add your baseline ERP to the TIPS yield plus the 10-year breakeven inflation rate, which is based on the difference in yield between a 10-year TIPS and a 10-year Treasury (this is what the “market” expects inflation to be over the next ten years).
| Baseline ERP | 3.00% |
| Yield on TIPS | 2.01% |
| Real Return | 5.01% |
| Expected Inflation | 2.29% |
| Nominal Return | 7.30% |
Hmmm… 5.01% real/7.3% nominal is oddly close to the 5% real return assumptions we saw from Networthify and Vanguard in Part 1. If I increased my baseline ERP to 3.5%, I’d be closer to the “8–10% returns” commonly quoted in the Financial Independence community. Now you see why expected returns are so important. A historically “average” baseline ERP (3-5%) is expected to deliver about 8-10 percent per year.
Setting Your Guardrails: Floors and Ceilings
Now that we have figured out a baseline ERP for our model, we need to set some guardrails. While the Merton Share is brilliant in theory, it can sometimes suggest extreme allocations — like over 100% in stocks or nothing in stocks. In the real world, that’s not always practical or comfortable. That’s why it’s smart to put “guardrails” on your equity allocation by setting a baseline, minimum (floor) and a maximum (ceiling).
The baseline equity allocation avoids the need to define a risk aversion value for γ (gamma). You set an overall equity allocation that you would be comfortable with if markets were at historically average valuations, with an equity risk premium in the “normal” range. Like the baseline ERP, this is all subjective, but is much more grounded than “gamma,” which is gives you no context for decision-making.
The floor and ceiling guardrails are also subjective values, but they mean your actual stock allocation will always stay within a range you’re comfortable with, even if the Merton Share calculation suggests going higher or lower. This practical adjustment helps you stick to your plan without getting too wild or too conservative. A moderately aggressive starting point could be a 50% floor and a 100% ceiling, but you could choose anything between 0% stocks for the floor and 100% stocks for the ceiling (technically you could go below 0% with shorting and above 100% with leverage).
Your Portfolio’s Expected Return: A Compass for Retirement
Now we’re ready to calculate the portfolio’s asset allocation. The minimum variance blend of US/International stocks (60% US, 40% International) yields a weighted combined CAEY of 3.64% and an equity premium of 1.63%. If we apply a baseline equity allocation of 75%, a minimum equity allocation of 50%, and a maximum of 100%, we get the following asset allocation:
| Variable | Value |
|---|---|
| Combined CAEY | 3.64% |
| Equity Premium | 1.63% |
| Baseline Equity Risk Premium | 3.00% |
| Baseline Equity Allocation | 75% |
| Floor Equity Allocation | 50% |
| Ceiling Equity Allocation | 100% |
| Final Equity Allocation | 64% |
So, using the US/International allocation determined in the previous step and applying it to the equity allocation, we now can set the appropriate weights to each asset class. The expected real return (inflation-adjusted) is the weighted average yield of each asset, currently 3.05%. The expected inflation is the 10-year breakeven inflation rate we discussed earlier. The expected nominal return is simply the real return plus the breakeven inflation rate.
| Asset | Allocation |
| US (S&P 500) | 38% |
| International (Large Cap Dev.) | 26% |
| Bonds (10-Year TIPS) | 36% |
| Expected Real Return | 3.05% |
| Expected Inflation | 2.29% |
| Expected Nominal Return | 5.34% |
While a 5.34% rate of return over the next ten years may not seem very high to you, remember that a 100% stock portfolio only has a 5.93% expected return (3.64% CAEY + 2.29% breakeven inflation rate), so you are mitigating the risk that stocks underperform expectations.
You can use broad-based total market funds for domestic and international equities. In both cases, the returns and risk profiles will be fairly similar due to the weighting of large cap stocks in the market. Also, for my purposes, I don’t use 10-Year TIPS. If you don’t have a TIPS fund available in your portfolio, Treasury funds or Bond Index funds can work perfectly well and are more diversified.
Here are some of the benefits of this approach:
- Better Retirement Date Estimates: Instead of relying on inflated historical averages, using realistic expected returns for your portfolio helps you project your retirement date more accurately. This prevents over-optimism that could lead to disappointment down the road.
- Smarter Risk Management: Dynamic asset allocation, which adjusts your portfolio based on these expected returns and market risk levels, helps you manage risk more effectively. When markets are overvalued (high CAPE, low expected returns), the Merton Share might suggest reducing your equity exposure, potentially cushioning you from big drops. Conversely, when markets are undervalued, it might suggest increasing your exposure, positioning you for better future gains. It also has the pleasant effect of increasing your expected returns when markets falter, meaning your projected retirement date won’t change as much.
- Staying the Course: One of the biggest challenges for investors is emotional decision-making during market ups and downs. A rules-based approach, guided by the Merton Share, helps you avoid impulsive reactions. Instead of panicking and selling when the market drops, your pre-defined strategy tells you how to adjust, helping you “stay the course” and potentially capitalize on opportunities.
- Realistic Rebalancing: Elm Wealth’s dynamic asset allocation model implies weekly rebalancing among the funds in their portfolio to account for changes in volatility in the market. For DIY investors, that is not advisable. While volatility does vary significantly over time, the potential transactional costs (fees, spreads, and taxes) mean this approach is pretty impractical. The approach outlined above also avoids the stomach ulcers you will surely receive from constantly monitoring the market. Using this approach you can choose the frequency of rebalancing, be it monthly, quarterly, or annually.
Your Personal Allocation Tool
To make this all super practical, I’ve put together a Google Sheet (please make a copy before editing) that can help you determine your global equity allocation using these principles. You can revisit this calculator every time you rebalance for a relatively subjective, but rules-based approach to your asset allocation informed by the equity risk premium and the Merton Share.
Here’s how it works:
- Inputs (Green Boxes): You’ll input your U.S., International, and Bond fund tickers. The sheet will automatically pull in their expense ratios. You’ll also set your desired equity floor, baseline, and ceiling allocations, along with your desired equity risk premium. While I was able to pull in the S&P CAPE ratio from a table published online, there isn’t a good automated source for international equity CAPE ratio. Instead, I suggest you pull it in manually. I use Asset Allocation Interactive from Research Affiliates and provide instructions in the Google Sheet. Other sources are available for international CAPE ratios but they aren’t as user friendly. Note that you can also choose between various methods of allocating geographically, whether it be market capitalization or minimum variance.
- Calculations: I pull in data from a variety of sources, including companiesmarketcap.com, Early Retirement Now, the Federal Reserve Bank of St. Louis, and multpl.com. The process is fairly automated as long as you update the fields in green, but it is always good to check the references and links included in the spreadsheet!
- Outputs (Red Fields): The sheet calculates key metrics like current Cyclically Adjusted Earnings Yields (CAEYs) for U.S. and International markets. It also shows the market capitalization weights for U.S. and International equities. Finally, it provides your suggested combined equity premium, combined expected returns, and the resulting asset allocations adapted from the Merton Share, adjusted for your floor and ceiling.
While this tool helps you visualize how different inputs and market conditions translate into a recommended asset allocation, it is not a recommendation to invest in any particular fund or asset class. Remember, your own investing choices are yours to make and this should not be taken as investing advice!
Conclusion: Risk adjusted expected returns beat short-term wins
It’s important to remember that while the Merton Share aims for an optimal allocation, the real world is messy. The theoretical model assumes things like constant volatility and continuous rebalancing, which aren’t perfectly true in practice.
But the goal of this dynamic approach isn’t to beat the market every single year or to perfectly time every peak and trough. Instead, it’s about maximizing your expected long-term risk-adjusted returns. In a future article I may back test this model, but Elm’s success validates the basic concepts.
By systematically adjusting your portfolio based on valuation signals and your personal risk tolerance, you’re building a more resilient strategy. This disciplined, valuation-aware approach helps you navigate market cycles with more confidence, rather than chasing short-term gains or panicking during downturns. It’s about having a flexible “blueprint” that guides your decisions, ensuring your money is working smarter for you over the decades.
What do you think? Are you convinced or is your static investment approach serving you well?

You must be logged in to post a comment.